

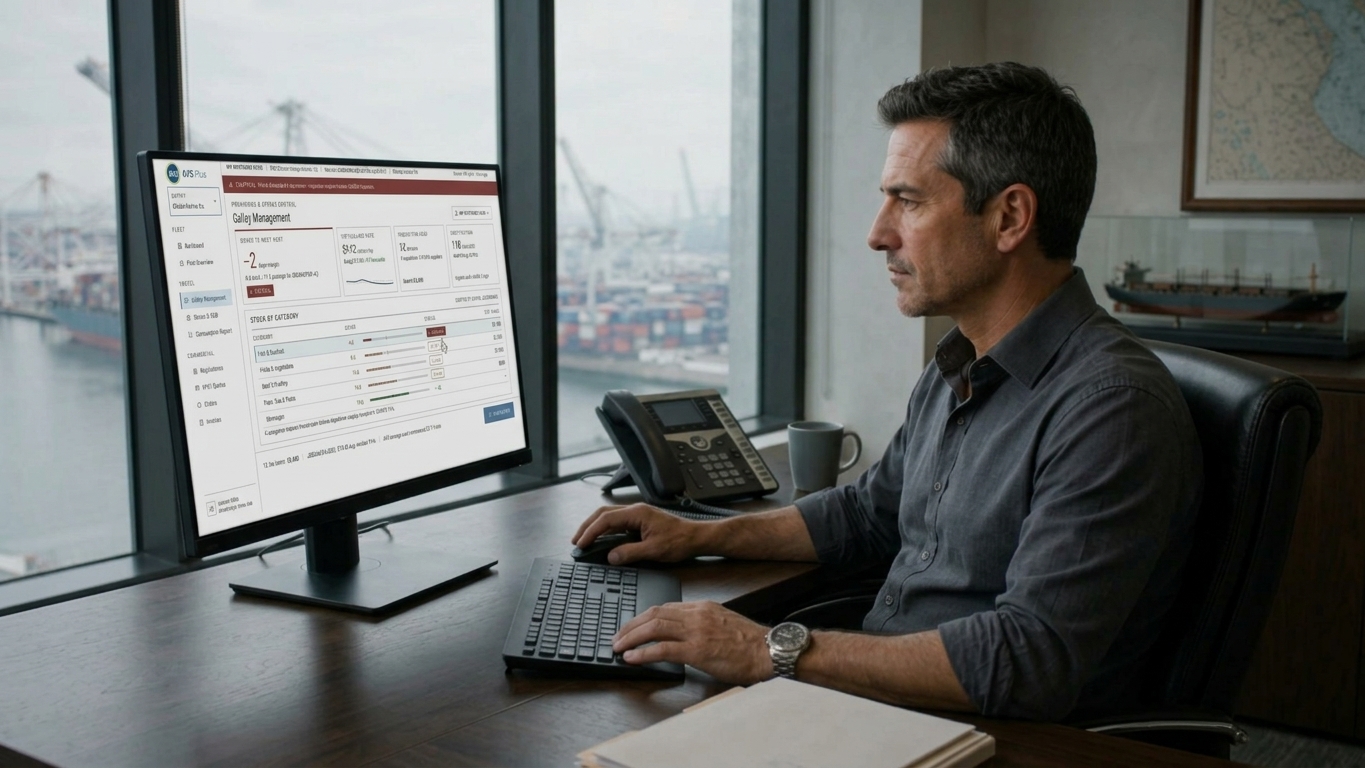
Ship Supply Cost Control Across a Fleet: Spend, Budget and Variance
Ship supply cost control is not achieved by negotiating the lowest unit price on every order. Across a fleet, the true cost of supply depends on what was requested, how much usable stock was already onboard, where and when the vessel was supplied, how urgent the delivery became and whether the operating profile changed during the period.
The objective is not to make every vessel spend the same amount. Different vessels have different crew sizes, routes, storage limits, technical requirements and delivery opportunities. Effective control makes those differences visible, measurable and explainable so that fleet managers and procurement teams can distinguish operational necessity from avoidable cost. This article explains how to compare vessel spending fairly, calculate budget variance, connect inventory with purchasing records and identify the operational causes behind higher costs.
For fleets covered by an AVS catering agreement, the AVS+ Customer Portal connects this cost-control question to day-to-day operational records by bringing contracted vessels, provision and catering orders, invoices, stock visibility and reporting into one workflow. This gives authorized teams earlier visibility into where a variance begins and what requires investigation. AVS+ is available exclusively within AVS catering contracts and is not offered as a standalone public platform.
Why Ship Supply Costs Vary Between Vessels
A fleet-wide comparison becomes misleading when total spend is viewed without operational context. A vessel may spend more because it carried a larger crew, completed a longer voyage, called at a higher-cost port or received a consolidated order intended to cover several weeks. Another vessel may appear less expensive only because a planned purchase was postponed to the next reporting period.
Common cost drivers include:
- Crew size and crew-days: Provision requirements generally rise with the number of people onboard and the number of days covered.
- Route and port availability: Product availability, local pricing, delivery windows and logistics conditions vary between ports.
- Purchasing category: Provisions, technical stores, safety supplies and delivery-related charges follow different cost patterns.
- Order timing: Planned and consolidated purchases usually create a different cost profile from urgent, last-minute requests.
- Specification and quality requirements: Brand, certification, size, grade, shelf life and approved-equivalent rules affect sourcing options.
- Existing inventory: A vessel with sufficient usable stock should not be assessed in the same way as a vessel rebuilding depleted inventory.
- Operational change: ETA changes, route revisions, crew changes, maintenance requirements and longer-than-planned voyages can alter demand.
A higher-spend vessel is therefore not automatically inefficient. The first task is to identify whether the difference is caused by activity, price, quantity, purchasing mix, logistics or an exception that requires investigation.
Budget vs Actual: The First Level of Fleet Cost Control
Budget-versus-actual analysis provides the starting point for fleet supply budget management. It compares the approved or expected spend for a defined period with the cost that was actually recorded.
Absolute variance = Actual spend − Budgeted spend
Variance percentage = (Actual spend − Budgeted spend) ÷ Budgeted spend × 100
If the approved budget is zero, a percentage variance is not meaningful; the absolute difference and the reason for the unbudgeted purchase should be reviewed instead.
For example, if a vessel has a budget of 80,000 for the period and records actual spend of 88,000, the absolute variance is 8,000 and the variance is 10%. This is only a signal, not a conclusion. If crew-days increased by 12%, the normalized cost may have remained within plan even though total spend rose.
A useful budget comparison should therefore define:
- the reporting period and currency convention;
- the vessels and purchasing categories included;
- whether delivery, launch, agency or other logistics charges are included;
- the operational assumptions behind the budget;
- the normalization basis, such as crew-day, operating day, port call or planned maintenance event.
For provisions and catering, cost per person per day—also described as man-day cost—can help separate crew-volume effects from purchasing performance. Technical stores require a different baseline because demand is driven more by equipment specifications, maintenance schedules, criticality and failure risk than by crew size.
How AVS+ Supports Cost Visibility for Contracted Catering Fleets
Budget control becomes more practical when fleet teams can follow the records behind the total. For AVS contracted catering customers, the AVS+ Customer Portal brings contracted vessels, provision and catering orders, invoice records, stock visibility and operational reporting into one unified workflow.
This supports faster access to historical purchasing information and clearer follow-up without relying on fragmented email chains. Reviewing purchasing patterns, order status, invoices and available stock information in context strengthens vessel spending visibility and makes it easier to identify whether a variance is linked to quantity, timing, repeated requests, stock position or another operational factor.
AVS+ supports visibility and decision-making; it does not guarantee a specific saving percentage or replace procurement approvals, onboard stock discipline or operational judgement. Access is provided exclusively to customers with an AVS catering contract and applies to vessels covered by that agreement.
Comparing Supply Spend by Vessel and Purchasing Category
Fleet comparison should begin with like-for-like groups. Similar vessel type, crew profile, route pattern, service scope and reporting period create a more reliable peer group than a single ranking of all vessels from lowest to highest spend.
Within each peer group, procurement teams can separate four different effects:
- Price effect: The same or equivalent item was purchased at a different unit price.
- Quantity effect: More units were ordered because of crew-days, voyage duration, maintenance activity or inaccurate demand planning.
- Mix effect: The vessel purchased a different combination of products, brands, grades or categories.
- Logistics effect: Delivery location, timing, launch requirements, consolidation or schedule changes altered the delivered cost.
Spend should also be divided into meaningful categories. Provisions may be reviewed by fresh, frozen and dry stores, while technical purchases may be grouped by engine, deck, safety or other operational requirements. Consistent category definitions are essential; otherwise, the same item may appear under different headings on different vessels.
For fleets operating across multiple ports, a coordinated global ship supply network can help maintain a clearer supply journey across local sourcing, communication and delivery follow-up.
How Inventory and Purchasing Data Affect Cost Visibility
Purchasing data explains what entered the vessel. Inventory data helps explain what was available before the order and what remained afterwards. Cost analysis is incomplete when these records are reviewed separately.
A practical consumption estimate is:
Estimated consumption = Opening stock + Receipts − Closing stock
The calculation must be adjusted for transfers, damaged goods, expired stock, returns and counting corrections. It is only reliable when vessels use consistent product codes, units of measure and stock-counting practices.
Without inventory context, a high purchase value may be mistaken for overconsumption even though the vessel was rebuilding stock before a long voyage. Conversely, low purchasing may appear efficient while critical stock is being depleted. Connecting inventory and purchasing records helps teams distinguish:
- actual consumption from stock accumulation;
- planned replenishment from repeated emergency buying;
- usable stock from slow-moving, damaged or expiring items;
- genuine demand growth from inconsistent data entry.
A ship inventory management system can support this process, but system output is only as dependable as the underlying vessel, product and transaction data.
Detecting Urgent Purchases, Over-Ordering and Cost Variance
Cost variance becomes actionable when the report identifies the operational behaviour behind it. Fleet teams should look for repeated patterns rather than treating every exception as a procurement failure.
Useful warning signals include:
- a rising share of spend placed through urgent or last-minute orders;
- the same item being reordered while sufficient usable stock is recorded onboard;
- frequent small orders that could have been planned or consolidated;
- high closing stock, slow-moving products or repeated expiry and waste;
- unexplained quantity differences between similar vessels;
- repeated substitutions caused by late specifications or limited local availability;
- invoice or delivery discrepancies that remain open across reporting periods.
Urgent purchasing is not always avoidable. ETA changes, equipment failure, unexpected crew changes or a rejected delivery can create a legitimate requirement. The important question is whether the event was exceptional or part of a repeated planning problem.
The choice between just-in-time and consolidated vessel supply should therefore reflect route stability, storage capacity, product shelf life, port availability and the operational risk of waiting for the next delivery opportunity.
What a Useful Fleet Supply Report Should Show
A useful report should help a manager decide what to investigate and what action to take. More charts do not automatically create better control. The report should combine cost, activity, inventory and exception data in a consistent view.
| Metric | What It Helps Explain |
|---|---|
| Actual spend vs budget | The size and direction of the period variance. |
| Variance percentage | Whether the difference is material relative to the approved budget. |
| Cost per crew-day or man-day | Provision and catering cost after adjusting for crew volume. |
| Spend by vessel and category | Where cost is concentrated and which categories drive change. |
| Planned vs urgent order share | Whether purchasing is moving towards reactive procurement. |
| Order frequency and average order value | Whether demand is fragmented across repeated small orders. |
| Stock value and stock coverage | Whether purchasing reflects actual onboard requirements. |
| Price, quantity, mix and logistics effects | Why spend changed instead of showing only that it changed. |
| Open requests, invoices and discrepancies | Which financial or operational actions remain unresolved. |
Every material variance should also allow space for operational context. A route change, additional crew, extended voyage, major maintenance event or supply moved to another port may explain the result more accurately than the number alone.
Moving from Individual Orders to Fleet-Level Cost Intelligence
Individual purchase orders show transactions. Fleet-level cost intelligence connects those transactions to vessels, inventory, invoices, operational activity and approved budgets. The transition requires a repeatable process:
- Standardize the data. Use consistent vessel identifiers, product categories, units, currencies and reporting periods.
- Connect the records. Link requests, orders, receipts, invoices and stock movements wherever possible.
- Normalize the comparison. Adjust for crew-days, voyage duration, vessel type, service scope or maintenance activity.
- Flag material exceptions. Focus attention on significant or repeated variance instead of reviewing every line equally.
- Investigate before acting. Confirm whether the cause is price, quantity, product mix, logistics, data quality or operational change.
- Close the loop. Update budgets, order templates, stock levels, approval rules or delivery planning based on the finding.
Build Better Cost Visibility Across Your Fleet
Effective ship supply cost management does not begin with a single cost-cutting target. It begins with consistent data, fair vessel comparisons and a clear explanation for every material variance. When budget, purchasing, inventory and operational context are reviewed together, fleet teams can reduce avoidable urgency, strengthen planning and make procurement decisions with greater confidence.
AVS contracted catering customers can explore how the AVS+ Customer Portal brings orders, invoices, stock visibility and reporting into one workflow. Organizations evaluating a broader catering management model can also review AVS Catering Fleet Intelligence.
Frequently Asked Questions
How should fleet teams compare ship supply spending?
Fleet teams should compare vessels with similar operating profiles and normalize the data using a relevant driver, such as crew-days for provisions or maintenance activity for technical stores. Orders, invoices, inventory and logistics charges should be reviewed within the same reporting period because total spend alone does not provide a fair comparison. For AVS contracted catering customers, the AVS+ Customer Portal brings contracted-vessel orders, invoices, stock visibility and reporting into one workflow to support this review.
How does ship inventory management affect supply costs?
Ship inventory management shows what was available before an order, what was received and what remained onboard. This helps teams distinguish genuine consumption from stock accumulation, identify repeated purchases and avoid judging a vessel’s supply cost without understanding its usable stock position. Within AVS catering contracts, AVS+ supports this review by bringing stock visibility together with order, invoice and reporting records for contracted vessels.
How are provisions supplied to vessels?
Vessel provision supply usually begins with crew numbers, voyage duration, dietary requirements, existing stock and the next delivery opportunity. The request is reviewed, products and approved equivalents are sourced, delivery is coordinated with the vessel schedule and port conditions, and the received quantities are checked against the order.
How should stock and budget be planned for a ship provision list?
A ship provision list should be based on crew size, days to be covered, planned menus, dietary requirements, usable closing stock, storage capacity and product shelf life. Applying an agreed cost-per-person-per-day target can support budgeting, but actual requirements and operational changes must still be reviewed. For AVS contracted catering customers, AVS+ supports this planning by making relevant order history, stock visibility and reporting easier to review for contracted vessels.
How is budget variance calculated in maritime procurement?
Absolute budget variance is calculated by subtracting budgeted spend from actual spend. Variance percentage is calculated as actual spend minus budgeted spend, divided by budgeted spend and multiplied by 100. The result should then be interpreted alongside quantity, price, product mix, logistics and operational changes.